Overview
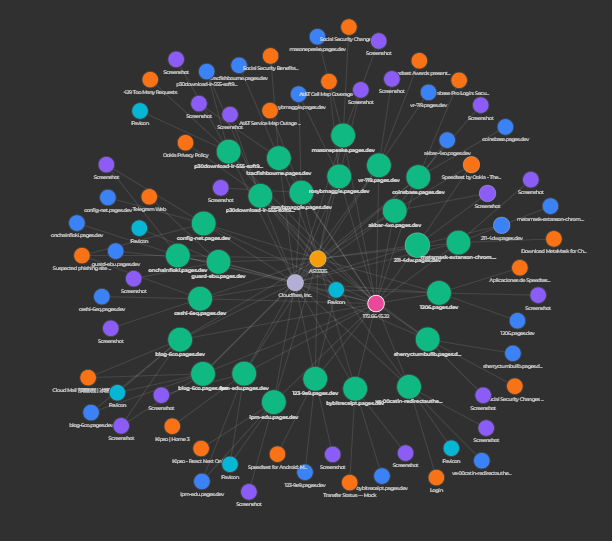
The urlDNA Scan Graph transforms traditional flat scan reports into an interactive network graph.Instead of scrolling through long scan details, analysts can visually explore how URLs, domains, IPs, certificates, technologies, and other attributes connect to each other. The Scan Graph provides immediate context, uncovers hidden relationships, and accelerates threat investigation.
Key Features
Forced Connected Graph
All scan attributes are displayed as interconnected nodes in a dynamic force-directed graph.Each node represents an entity such as:
- URL
- Redirect
- Domain
- IP address
- Favicon
- Screenshot
- ISP
- ASN
Intuitive Interaction
The graph is fully interactive:- Click any node to expand related data points
- Visualize how a single attribute—such as a domain or certificate—links to multiple scans
- Seamlessly build multi-layered, contextual investigation views
Flexible Starting Points
You can launch a graph from:- A specific scan result, to analyze its environment
- A search query, to correlate multiple scans at once
Custom Graph Storage
Premium users can save and load custom-built investigation graphs, preserving:- Node layout
- Expanded relationships
- Selected entities and attributes
- Reusable threat models
- Long-term investigations
- Consistent and sharable correlation views
- Easier return to ongoing analytical work
Actionable Visual Insights
The Scan Graph helps analysts:- Identify clusters of malicious infrastructure
- Trace phishing operations and campaigns
- Detect shared elements (IPs, certificates, technologies, trackers)
- Follow data trails to uncover hidden relationships
Settings
The Scan Graph includes a Settings panel that allows PREMIUM users to personalize the way their visual investigations behave.Custom Filters (Similar to My Queries)
Users can apply custom search filters to shape the data loaded into the graph.These filters function similarly to My Queries, enabling you to:
- Restrict expanded nodes to specific attributes
- Apply brand-specific or threat-specific criteria
- Avoid loading irrelevant or low-priority data
- Maintain consistent investigation logic across sessions
Max Child Nodes Per Search
To maintain graph clarity and control performance, users can define the maximum number of child nodes that each expansion can load. You can:- Set a global limit for all node types
- Prevent overly large expansions from cluttering the graph
- Keep graph structures focused and manageable
- Tune performance for your device or browser
Conclusion
The urlDNA Scan Graph provides a powerful visual method for analyzing and correlating scan data.By converting flat reports into an explorable network—and supporting saved graphs, filters, and customization—premium users gain deeper insight, faster workflows, and complete control over how their investigations unfold. Request a (demo).